Featured · Liquidation Levels
Free this week: the liquidation map behind Coinbase’s crypto loans
November 9, 2026
Every week we make one item from our x402 data API free for anyone to call. This week it is Liquidation Levels: where the collateral behind Coinbase’s USDC crypto loans would become liquidatable, by price level, across four Morpho markets and about 67,000 positions. Here is what is in it and three things you can build with it before Sunday.
Terms with a dotted underline link to the glossary.
Watch it in two minutes
What the dataset is
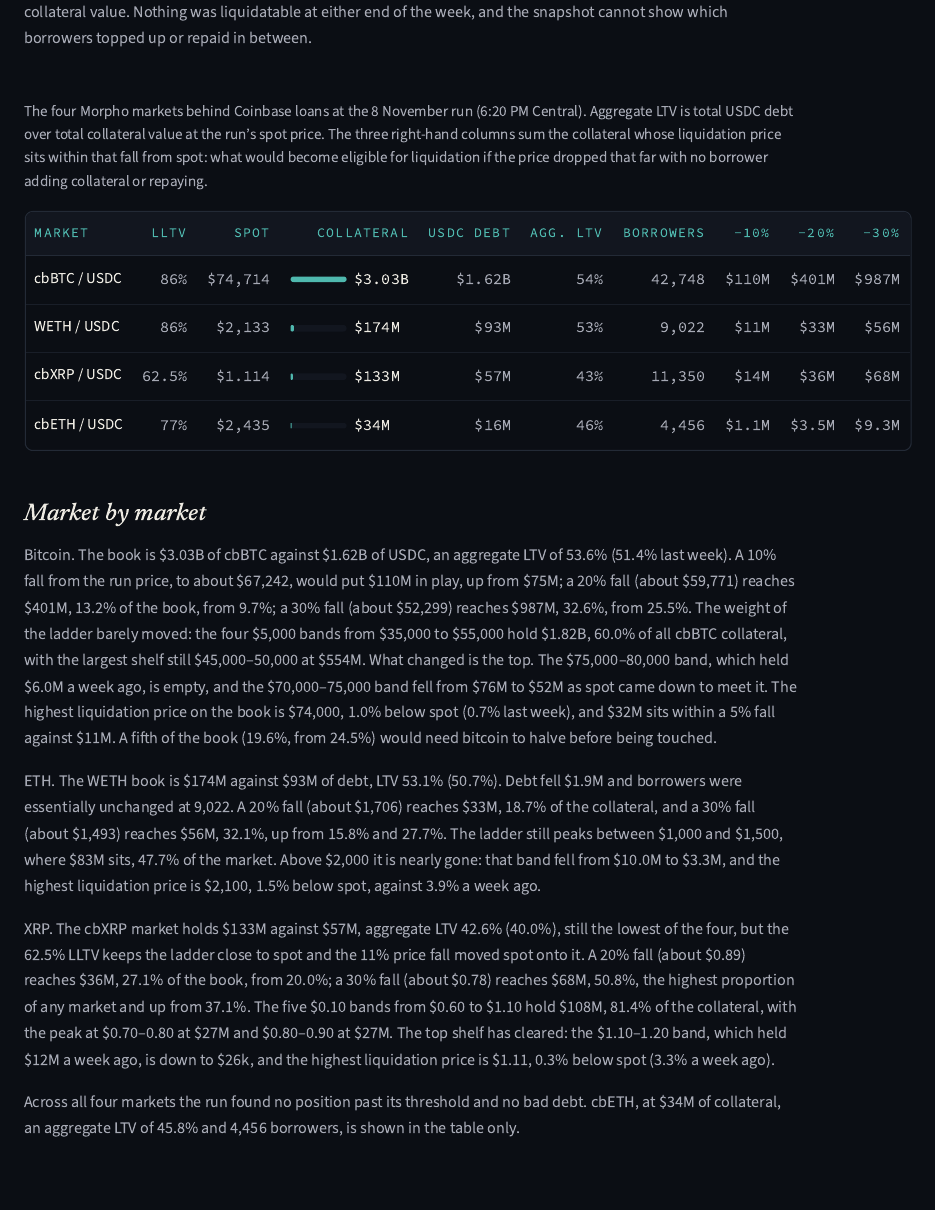
Coinbase’s crypto-backed USDC loans are made through four Morpho Blue markets on Base: bitcoin (cbBTC), ether (WETH, cbETH) and XRP (cbXRP). Every borrower position is public chain state. Each day we read all of them, roughly 67,000 positions, work out the collateral price at which each one becomes eligible for liquidation (debt ÷ collateral × the market’s liquidation threshold), and add the collateral up by price level.
The result is a ladder per market: how much collateral sits at $70,000 to $75,000 of bitcoin, how much at $60,000 to $65,000, and so on down. It is market-wide only. No wallet and no single position appears anywhere in it. It answers a question that price charts cannot: if the market falls by 10%, 20% or 30%, how much of this collateral becomes liquidatable?
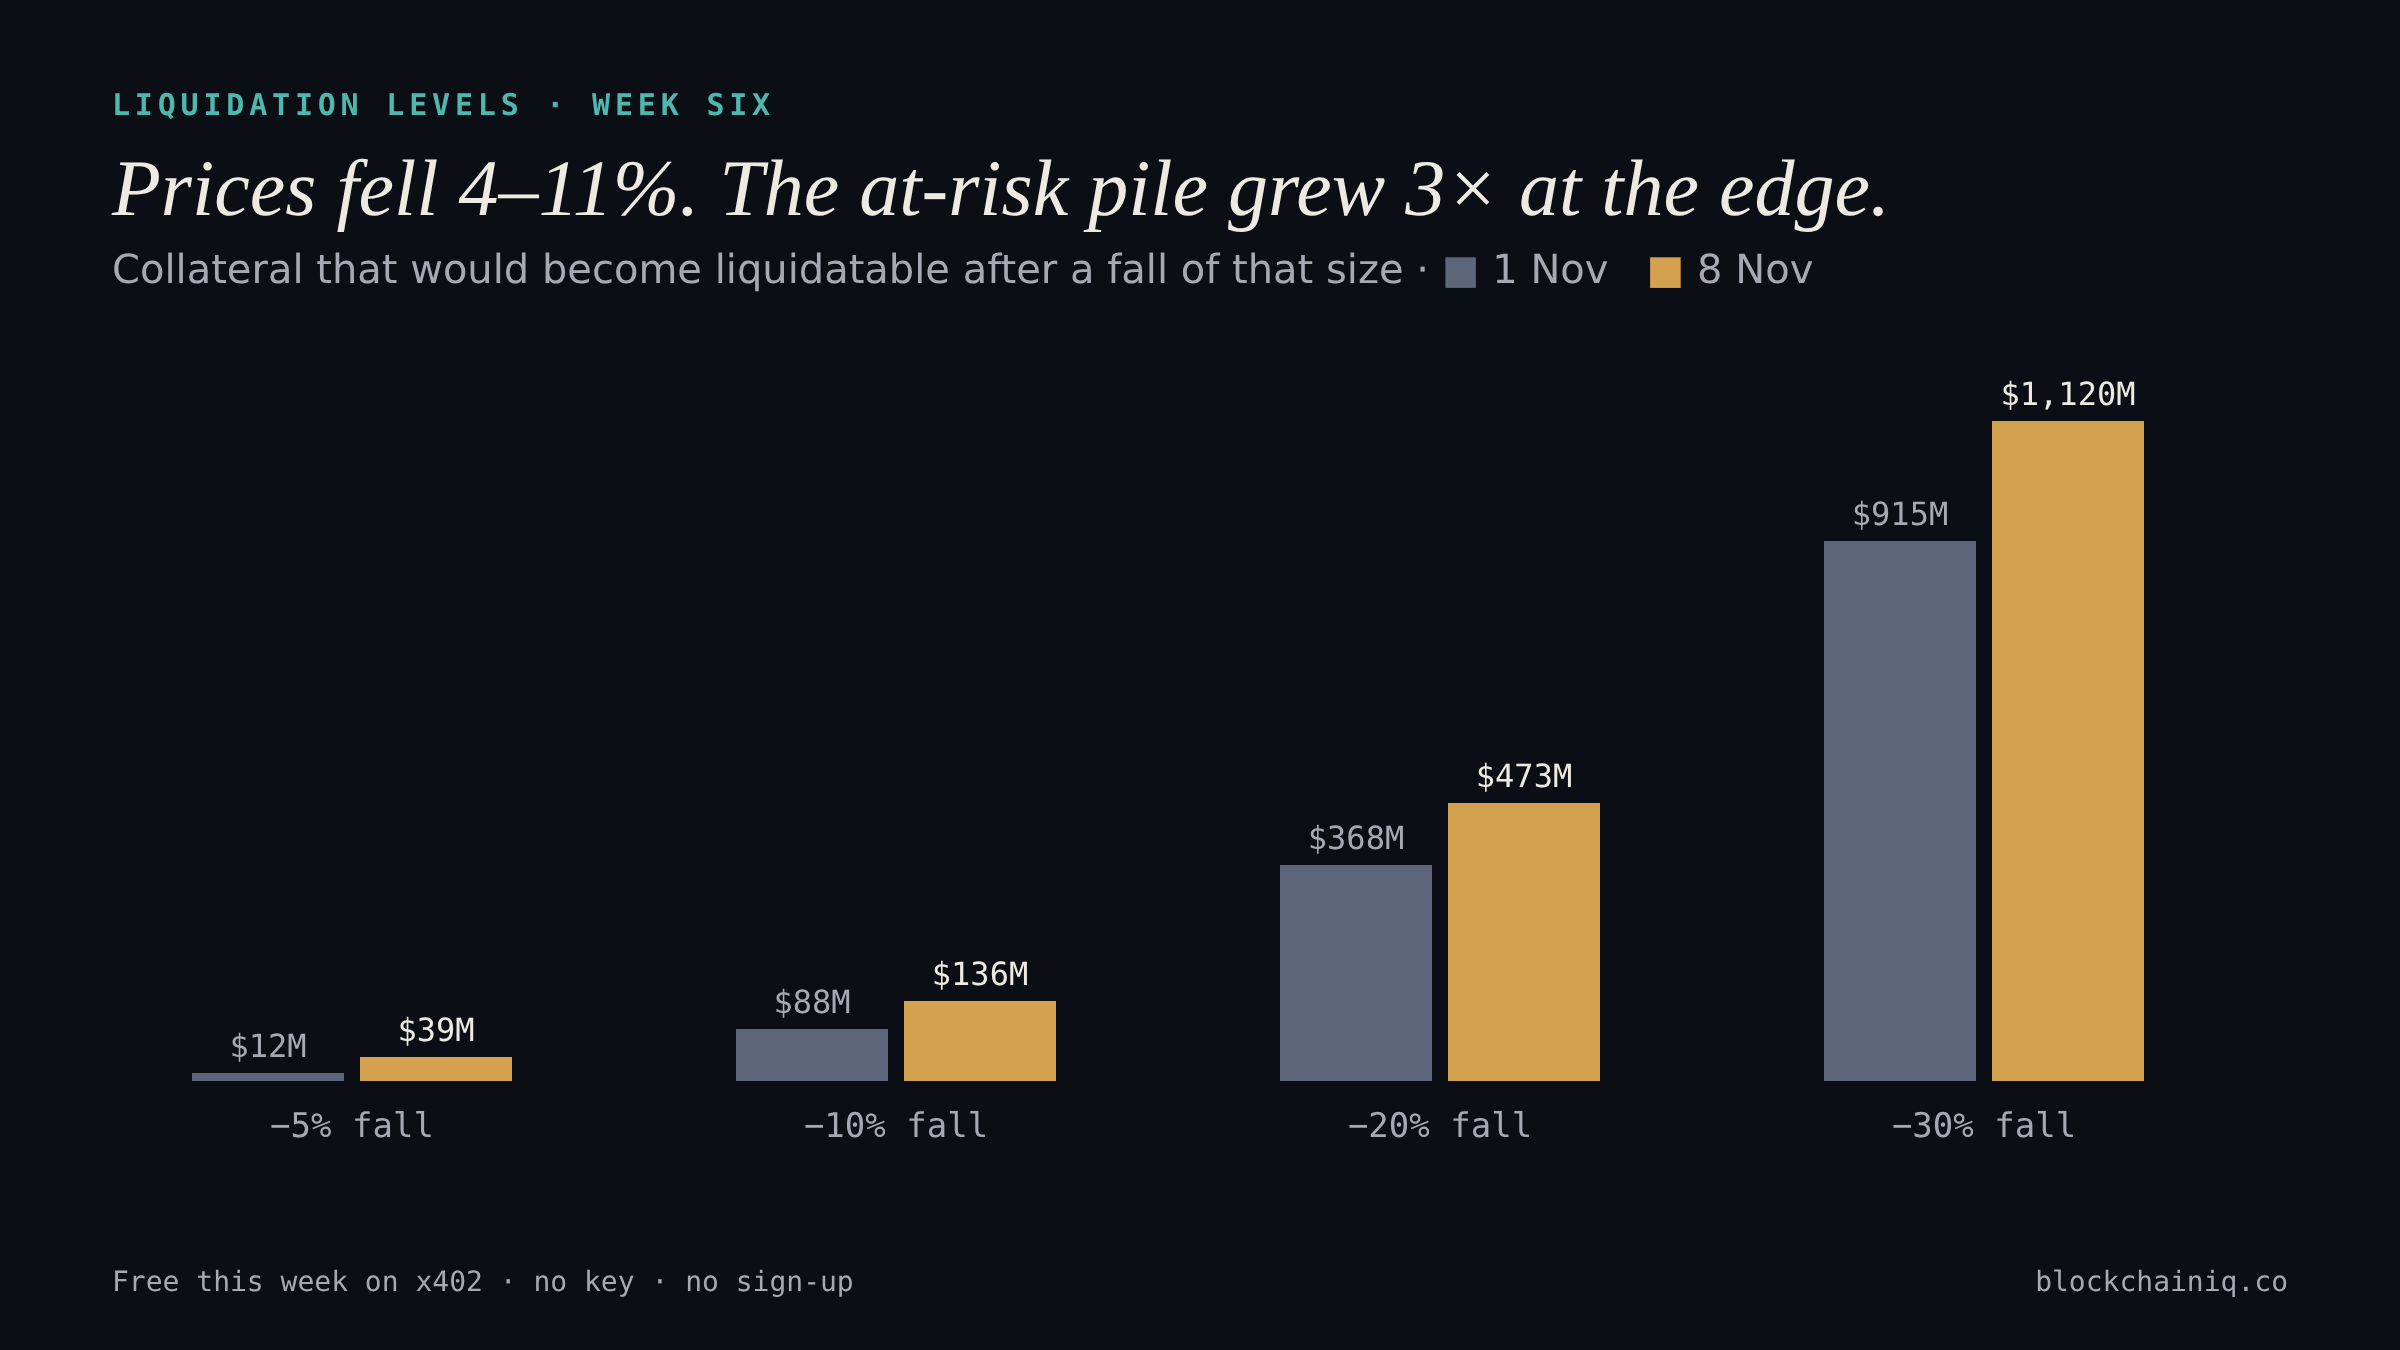
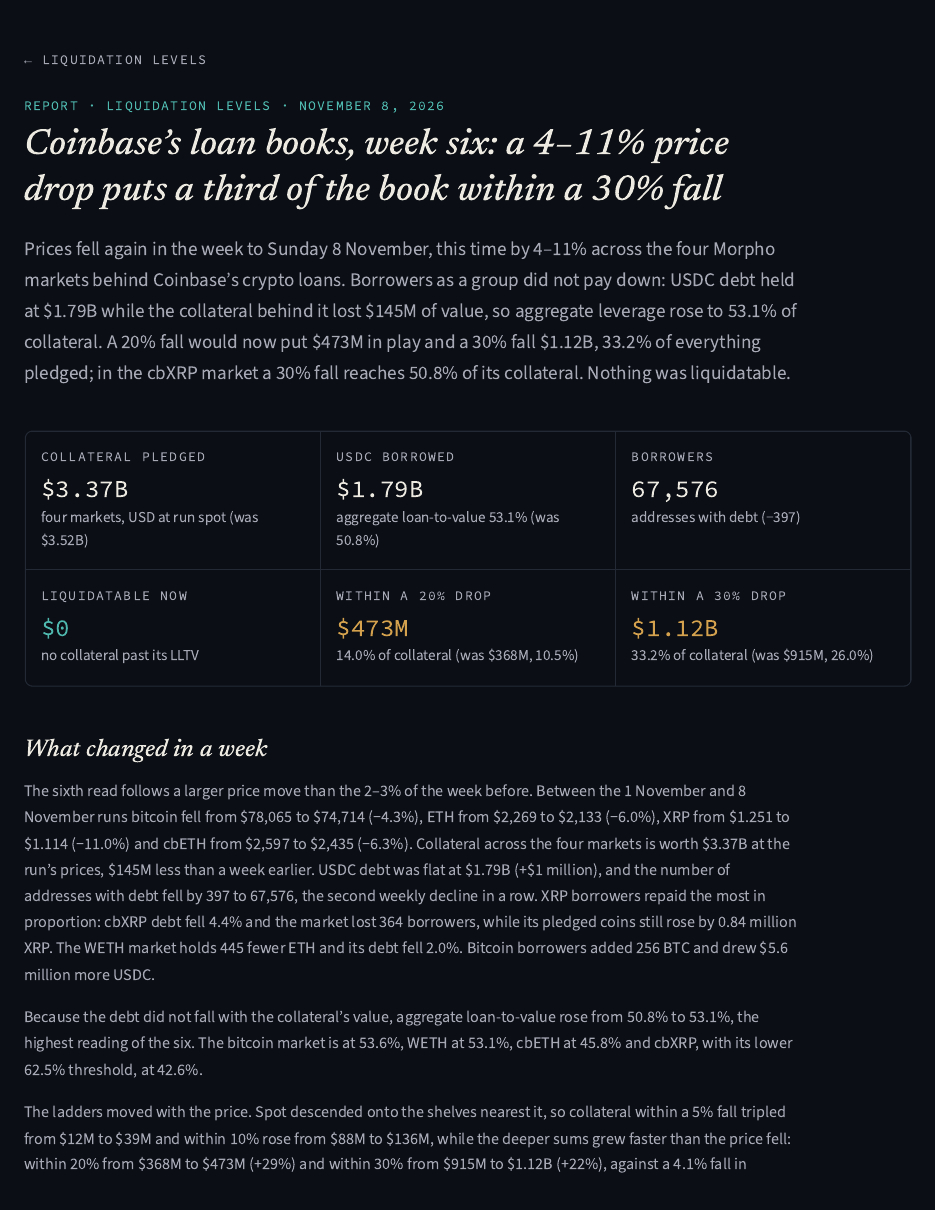
The latest read, from the run of Sunday 8 November, is below. Bitcoin fell 4.3% in the week, ether 6.0% and XRP 11.0%; USDC debt stayed at $1.79B, so leverage rose to 53.1% of collateral, and the amount a 20% fall would put in play rose from $368M to $473M.
What a fall would put in play
cbBTC: collateral by liquidation price
USD collateral at the 8 November run (bitcoin at $74,714), summed by the bitcoin price at which each position becomes liquidatable, in $5,000 bands. The first shelf sits at $70,000–75,000.
Each market at the 8 November run. “Within −20%” is the collateral whose liquidation price lies within a 20% fall of spot, assuming no repayment or top-up.
| Market | Collateral | Agg. LTV | Within −20% | Share | Within −30% | Share |
|---|---|---|---|---|---|---|
| cbBTC / USDC | $3.03B | 53.6% | $401M | 13.2% | $987M | 32.6% |
| WETH / USDC | $174M | 53.1% | $33M | 18.7% | $56M | 32.1% |
| cbXRP / USDC | $133M | 42.6% | $36M | 27.1% | $68M | 50.8% |
| cbETH / USDC | $34M | 45.8% | $3.5M | 10.4% | $9.3M | 27.2% |
Inside the weekly report
Three things you can build with it
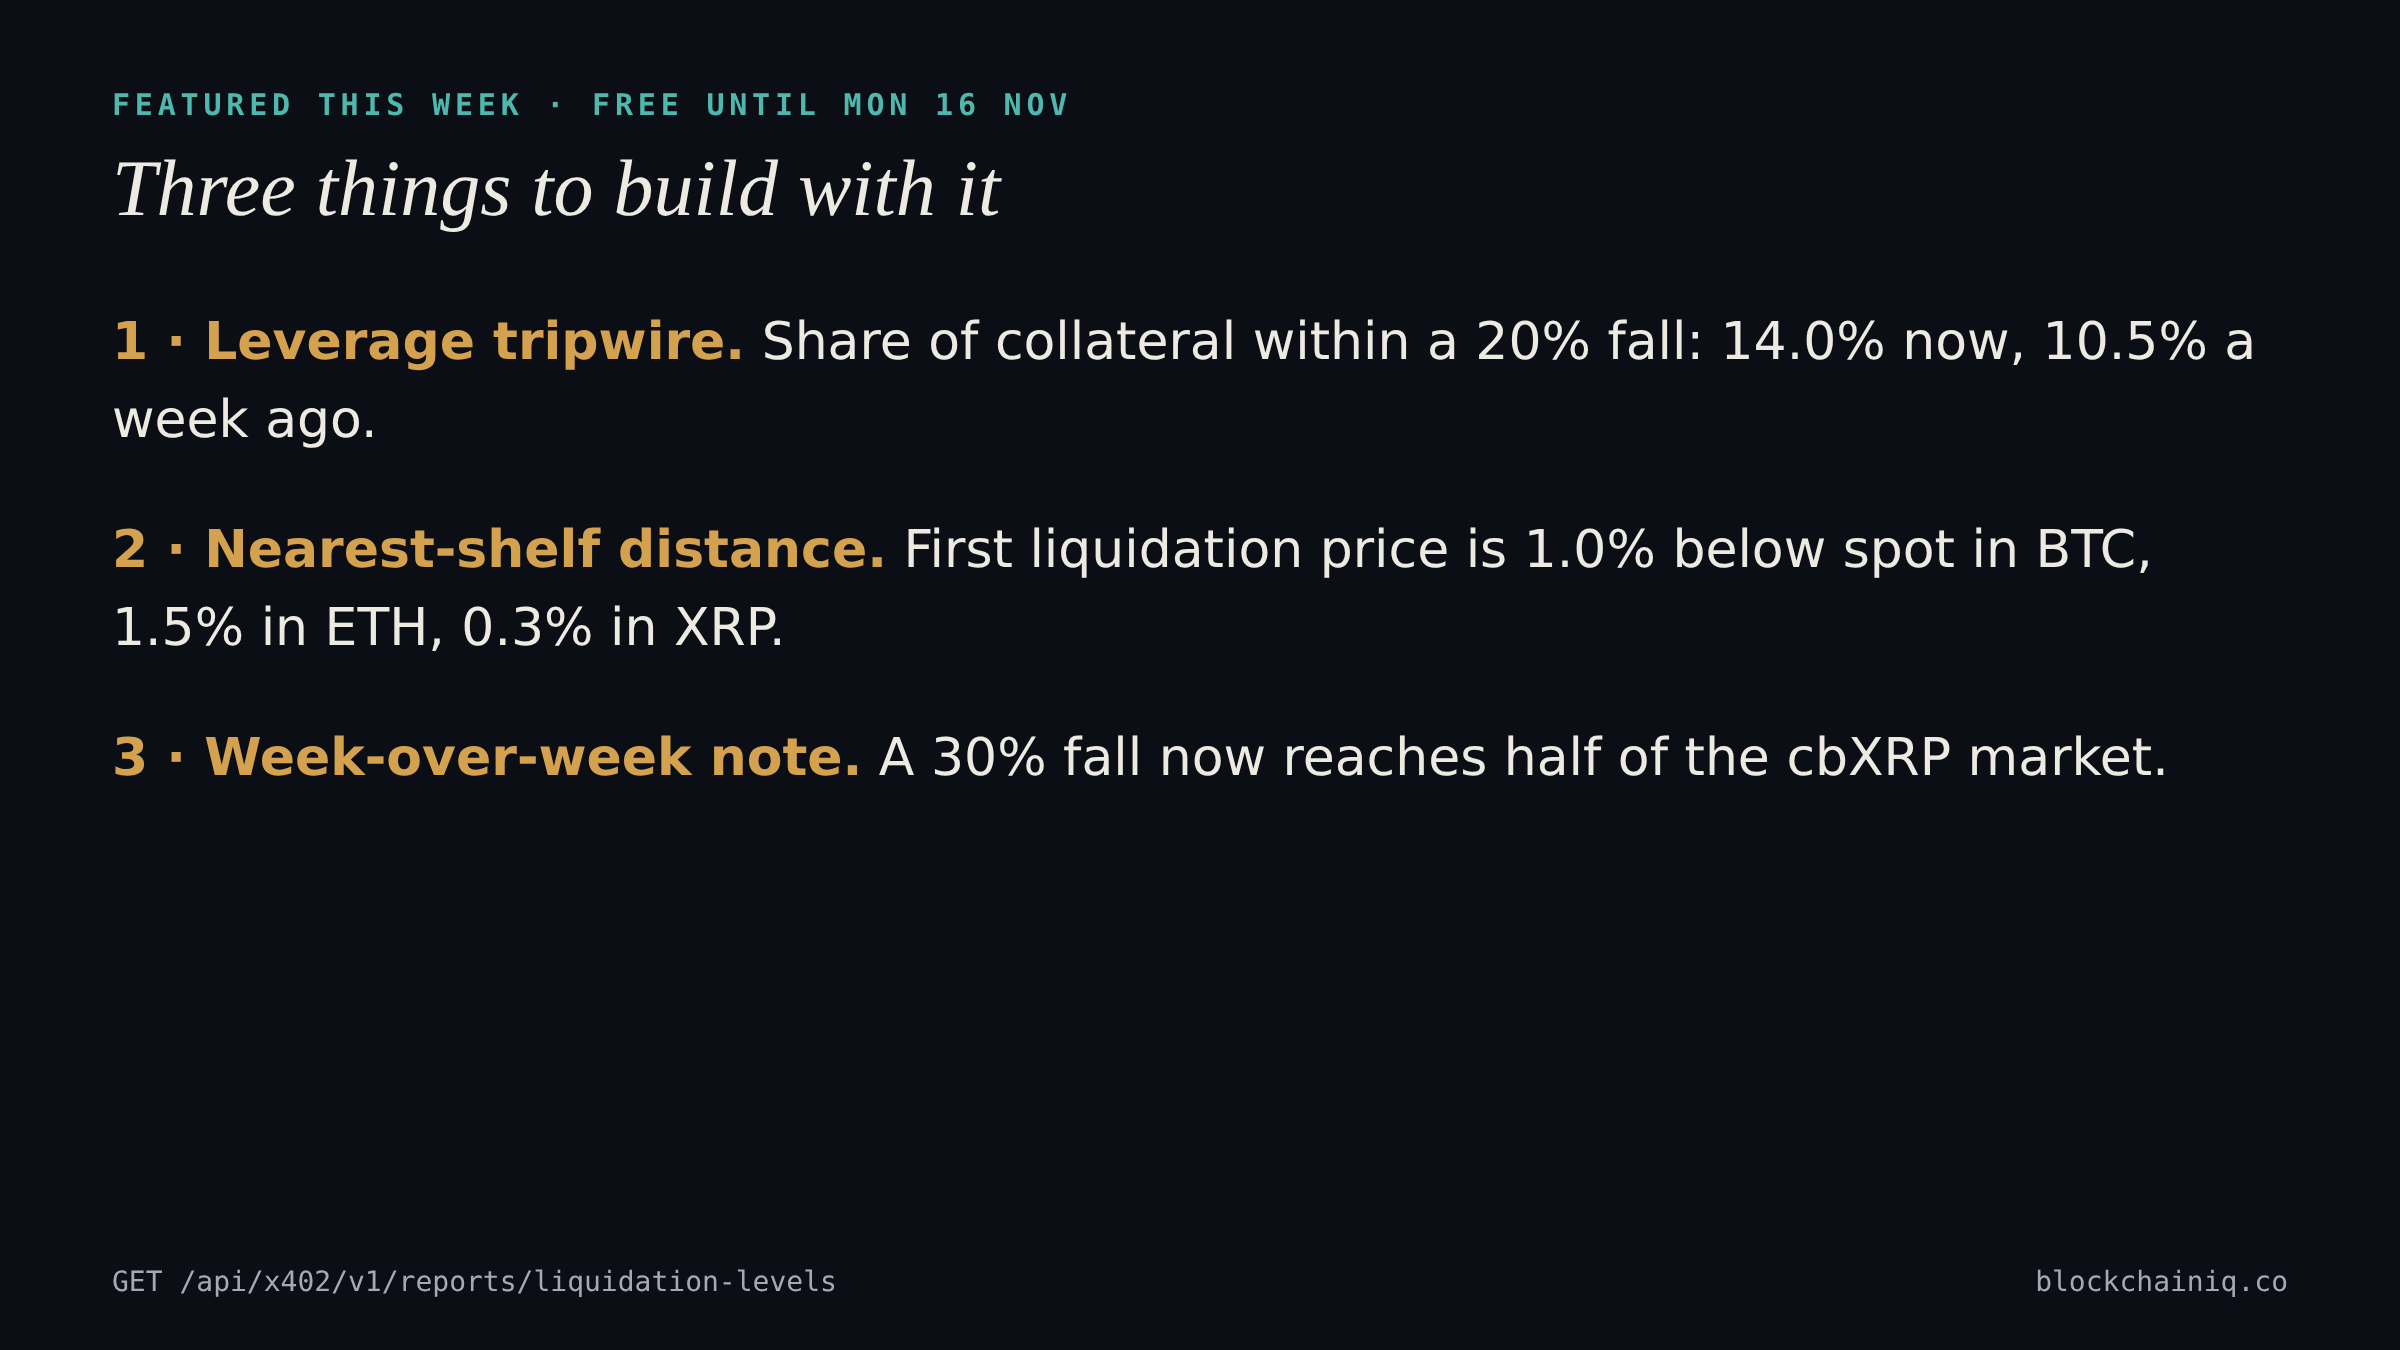
Case 1: a leverage tripwire for a risk dashboard, treasury or monitoring agent. Divide the collateral within a 20% fall by total collateral. This week that is 14.0%, up from 10.5% a week earlier, while the collateral itself lost 4.1% of its value. Pick a threshold that suits your own process, store the daily value, and alert on a rise: the ladder’s shelves stay put while spot moves toward them, so this number moves faster than price does. The snippet below computes it in four lines.
Case 2: a nearest-shelf distance for any agent that comments on market structure. For each market, take the highest liquidation price on the book and express it as a percentage below spot. At the 8 November run it was 1.0% below spot in bitcoin ($74,000), 1.5% in ETH ($2,100) and 0.3% in XRP ($1.11), against 0.7%, 3.9% and 3.3% a week earlier. A shrinking distance means the first liquidatable positions are now close to the current price.
Case 3: a week-over-week note for a newsletter or research desk. Pull the dated notes in the same response, compare the two most recent runs, and report which markets moved the most. This week cbXRP did: a 30% fall reaches 50.8% of its collateral, up from 37.1%, the highest share of any market. Our own weekly note does exactly this for you if you would rather read than build.
One call, no key
js
// npm install @x402/fetch @x402/evm viem
import { privateKeyToAccount } from "viem/accounts";
import { wrapFetchWithPayment, x402Client } from "@x402/fetch";
import { ExactEvmScheme } from "@x402/evm/exact/client";

const account = privateKeyToAccount(process.env.AGENT_PRIVATE_KEY); // a wallet with a little USDC on Base
const client = x402Client.fromConfig({
  schemes: [{ network: "eip155:*", client: new ExactEvmScheme(account) }],
  spendControls: { maxAmountPerPayment: 0.3 },
});
const payFetch = wrapFetchWithPayment(fetch, client);

const res = await payFetch("https://www.blockchainiq.co/api/x402/v1/reports/liquidation-levels");
const { data } = await res.json();
const { totals, markets } = data.edition;

// Case 1: the tripwire. Share of all pledged collateral within a 20% fall.
const share20 = totals.atRiskUsd["20"] / totals.collateralUsd;
if (share20 > 0.12) console.log("Liquidation shelf risk elevated:", (100 * share20).toFixed(1) + "%");

// Case 2: how far below spot does the first shelf start, per market?
for (const m of markets) {
  const top = Math.max(...m.levels.map((l) => l.bucketHigh));
  console.log(m.label, ((1 - top / m.spotPriceUsd) * 100).toFixed(1) + "% below spot");
}
Free this week, then back to $0.10
Liquidation Levels is our featured x402 item for the week of 9 to 15 November 2026. Any x402 client can call it free until Monday 16 November, 12:00 AM Central, with no sign-up and no key. Nothing about your wallet is recorded; we keep only a daily count of calls. Next week’s item is announced here on Monday morning, and the free catalog at https://www.blockchainiq.co/api/x402/v1 always shows what is for sale and what is free this week.
The data is also a Reports page for Blockchain IQ members, refreshed daily with a dated written note every Sunday evening.
Not advice
General market research, not financial advice — Blockchain IQ does not recommend for or against any token, loan or trade, and this data describes aggregates across tens of thousands of positions, never any one of them.
Figures are from the run of 2026-11-09 00:20 UTC (6:20 PM CST, Sunday 8 November 2026), compared with the run of 2026-11-02 00:20 UTC. “Within a 20% fall” sums collateral whose liquidation price lies between spot and 20% below it, assuming no repayment, top-up or interest; Morpho liquidation is partial and incentive-driven, so the sums describe eligibility, not a guaranteed sale.
Figures are aggregates across tens of thousands of positions. No individual wallet, borrower or position is identified or discussed.
This is general-circulation market research, for informational purposes only. It is not financial, investment or trading advice.